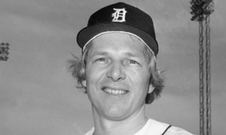
Jim Northrup

Right Field

1964—1975

jim-northrup
Player LeveL
Regular
Top 100 Rank
NR
Right Field RANK
#94

Player Detail

James Thomas
GIVEN NAME
Northrup
SURNAME
November 24, 1939, in Breckenridge, MI
BORN
June 8, 2011, in Grand Blanc, MI, USA
DIED
1964—1975
Playing Career
Played from 24-35
PLAYING AGE
Detroit Tigers
Montreal Expos
Baltimore Orioles
Teams Played For
Right Field
PRIMARY POSITION
Detroit Tigers
PRIMARY TEAM
1968
World Series titles
NONE
NICKNAME
NA
UNIFORM NUMBER
#5 IN LINEUP
BATTING ORDER
6-3 / 190
HEIGHT / WEIGHT
Left / Right
BATTED / THREW
September 30, 1964
Major League Debut
September 27, 1975
FINAL GAME

WHO IS Jim Northrup?

Hit key triple that sparked winning rally for Tigers in Game Seven of the 1968 World Series.

50

HITTING

50

POWER

50

RUNNING

50

FIELDING

50

THROWING
20 = NOT MLB CALIBER
30 = WELL BELOW AVG
40 = Below Average
50 = MLB AVERAGE
60 = ABOVE AVG
70 = EXCELLENT
80 = RARE, ELITE

Career Stats

GAMES HITS HR RBI AVG
1392
1254
153
610
.267

Teammate Team

CATCHER:
First Base:
Second Base:
Shortstop:
Third Base:
Left Field:
Center Field:
Right Field:
Pitcher:
pitcher:
manager:
COMING SOON

BEST SEASON

1968 Tigers

28 Years Old

.264
AVG
21
HR
90
RBI
76
RUNS
.324
OBP
153
HITS
29
2B
7
3B
.447
SLG
50
BB
4
SB
5.9
WAR

SLASH LINE

AVG OBP SLG
.267
.333
.429

FOR THE TRADITIONALISTS.

VERSUS HIS PEERS

OPS LG OPS COMP
.763
.731
104.6

PLAYER OPS COMPARED TO AVERAGE PLAYER AT HIS POSITION IN HIS LEAGUE AND ERA. OPS = ON-BASE + SLUGGING.

Hall of Fame Worthy?

JAWS JAWS BY HOFER
21.8
58.5

PLAYER JAWS COMPARED TO HOF PLAYER AT HIS POSITION. JAWS = AVERAGE OF CAREER WAR & WAR7.

Jim Northrup Per Season

PER 600 PLATE APPEARANCES COMPARED TO Contemporaries AT HIS POSITION

AB H R 2B 3B HR RBI BB SO SB TB TRB AVG OBP SLG OPS
Northrup
540
144
69
25
5
18
70
52
73
4
232
199
.267
.333
.429
763
AVG RF
534
139
69
22
4
15
55
85
9
214
197
.260
.331
.401
.731

Jim Northrup Rankings

AT Right Field BY THESE SOURCES

BASEBALL EGG HALL OF STATS BASEBALL SCHOLAR JAWS BILL JAMES
94
113
94
98
NR
Updated THRU 2021
Updated THRU 2021
UPDATED THRU 2021
Updated THRU 2021
UPDATED THRU 2020

AT Right Field BY VALUE

CAREER LONG PEAK PRIME SHORT PEAK
NR
98
83
85
CAREER WAR
WAR7
WAR 5 CONSECUTIVE
WAR3

Jim Northrup PLAYER VALUE

WAR COMPARED TO AVERAGE HALL OF FAMER AT HIS POSITION

CAREER WAR7 WAR5C WAR3 WAR PER SN
22.1
21.5
18.1
13.7
2.57
73.7
43.4
30.3
21.5
5.03
BLUE = Jim Northrup
GRAY = AVERAGE HALL OF FAME RF

WIN SHARES COMPARED TO AVERAGE HALL OF FAMER AT HIS POSITION

CAREER WIN SHARES 7 WIN SHARES 5C WIN SHARES 3 WS PER SN
161.7
132.6
UNK
69.2
18.8
389.8
205.2
143.3
96.9
26.7
BLUE = Jim Northrup
GRAY = AVERAGE HALL OF FAME RF

— Explanation of Advanced Statistics —

Wins Above Replacement is a non-standardized sabermetric statistic developed to sum up a player’s total contributions to his team. A player’s WAR value is claimed to be the number of additional wins his team has achieved above the number of expected team wins if that player were substituted with a replacement-level player:

A player’s best seven seasons according to his Wins Above Replacement (WAR). Also called LONG PEAK.

A player’s best five consecutive seasons according to his Wins Above Replacement (WAR). Also called PLAYER PRIME.

A player’s best three seasons according to his Wins Above Replacement (WAR). Also called SHORT PEAK.

A player’s Wins Above Replacement (WAR) per season (calculated for 162 games).

Advanced statistical method devised by Bill James. A Win Share represents one-third of a team win, by definition, and takes into account defense, offense, baserunning, park effects, and level of competition, era, and many other factors.

A player’s best seven seasons according to his Win Shares. A measure of LONG PEAK.

A player’s best five consecutive seasons according to his Win Shares. A measure of a player’s PRIME.

A player’s best three seasons according to his Win Shares. A measure of a player’s SHORT PEAK.

A player’s Win Shares per season (calculated for 162 games).

0
Would love your thoughts, please comment.x
()
x