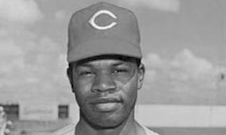
Tommy Harper

Left Field

1962—1976

tommy-harper
Player LeveL
Regular
Top 100 Rank
NR
Left Field RANK
#85

Player Detail

Tommy
GIVEN NAME
Harper
SURNAME
October 14, 1940, in Oak Grove, LA
BORN
STILL LIVING
DIED
1962—1976
Playing Career
Played from 21-35
PLAYING AGE
Cincinnati Reds
Cleveland Indians
Seattle Pilots
Milwaukee Brewers
Boston Red Sox
Baltimore Orioles
Teams Played For
Left Field
PRIMARY POSITION
Cincinnati Reds
PRIMARY TEAM
NONE
World Series titles
NONE
NICKNAME
17
UNIFORM NUMBER
#1 IN LINEUP
BATTING ORDER
5-9 / 165
HEIGHT / WEIGHT
Right / Right
BATTED / THREW
April 9, 1962
Major League Debut
September 29, 1976
FINAL GAME

60

HITTING

60

POWER

70

RUNNING

60

FIELDING

60

THROWING
20 = NOT MLB CALIBER
30 = WELL BELOW AVG
40 = Below Average
50 = MLB AVERAGE
60 = ABOVE AVG
70 = EXCELLENT
80 = RARE, ELITE

Career Stats

GAMES HITS HR RBI AVG
1810
1609
146
567
.257
1 ALL-STAR SELECTIONS

Teammate Team

CATCHER:
First Base:
Second Base:
Shortstop:
Third Base:
Left Field:
Center Field:
Right Field:
Pitcher:
pitcher:
manager:

BEST SEASON

1970 Brewers

29 Years Old

.296
AVG
31
HR
82
RBI
104
RUNS
.377
OBP
179
HITS
35
2B
4
3B
.522
SLG
77
BB
38
SB
7.4
WAR

SLASH LINE

AVG OBP SLG
.257
.338
.379

FOR THE TRADITIONALISTS.

VERSUS HIS PEERS

OPS LG OPS COMP
.717
.734
97.9

PLAYER OPS COMPARED TO AVERAGE PLAYER AT HIS POSITION IN HIS LEAGUE AND ERA. OPS = ON-BASE + SLUGGING.

Hall of Fame Worthy?

JAWS JAWS BY HOFER
24.2
55.9

PLAYER JAWS COMPARED TO HOF PLAYER AT HIS POSITION. JAWS = AVERAGE OF CAREER WAR & WAR7.

Tommy Harper Per Season

PER 600 PLATE APPEARANCES COMPARED TO Contemporaries AT HIS POSITION

AB H R 2B 3B HR RBI BB SO SB TB TRB AVG OBP SLG OPS
Harper
525
135
81
21
3
12
47
63
90
34
199
201
.257
.338
.379
717
AVG LF
536
143
70
22
4
14
52
80
11
215
199
.266
.333
.401
.734

Tommy Harper Rankings

AT Left Field BY THESE SOURCES

BASEBALL EGG HALL OF STATS BASEBALL SCHOLAR JAWS BILL JAMES
85
99
86
91
76
Updated THRU 2021
Updated THRU 2021
UPDATED THRU 2021
Updated THRU 2021
UPDATED THRU 2020

AT Left Field BY VALUE

CAREER LONG PEAK PRIME SHORT PEAK
81
82
NR
53
CAREER WAR
WAR7
WAR 5 CONSECUTIVE
WAR3

Tommy Harper PLAYER VALUE

WAR COMPARED TO AVERAGE HALL OF FAMER AT HIS POSITION

CAREER WAR7 WAR5C WAR3 WAR PER SN
25.8
22.7
14.8
15.7
2.30
68.6
43.2
31.4
22.4
4.81
BLUE = Tommy Harper
GRAY = AVERAGE HALL OF FAME LF

WIN SHARES COMPARED TO AVERAGE HALL OF FAMER AT HIS POSITION

CAREER WIN SHARES 7 WIN SHARES 5C WIN SHARES 3 WS PER SN
201.8
146.4
113.8
77.3
18.0
368.7
208.0
151.6
101.2
26.4
BLUE = Tommy Harper
GRAY = AVERAGE HALL OF FAME LF

— Explanation of Advanced Statistics —

Wins Above Replacement is a non-standardized sabermetric statistic developed to sum up a player’s total contributions to his team. A player’s WAR value is claimed to be the number of additional wins his team has achieved above the number of expected team wins if that player were substituted with a replacement-level player:

A player’s best seven seasons according to his Wins Above Replacement (WAR). Also called LONG PEAK.

A player’s best five consecutive seasons according to his Wins Above Replacement (WAR). Also called PLAYER PRIME.

A player’s best three seasons according to his Wins Above Replacement (WAR). Also called SHORT PEAK.

A player’s Wins Above Replacement (WAR) per season (calculated for 162 games).

Advanced statistical method devised by Bill James. A Win Share represents one-third of a team win, by definition, and takes into account defense, offense, baserunning, park effects, and level of competition, era, and many other factors.

A player’s best seven seasons according to his Win Shares. A measure of LONG PEAK.

A player’s best five consecutive seasons according to his Win Shares. A measure of a player’s PRIME.

A player’s best three seasons according to his Win Shares. A measure of a player’s SHORT PEAK.

A player’s Win Shares per season (calculated for 162 games).

0
Would love your thoughts, please comment.x
()
x