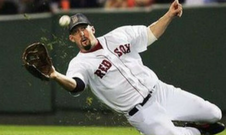
Trot Nixon

Right Field

1996—2008

trot-nixon
Player LeveL
Regular
Top 100 Rank
NR
Right Field RANK
#97

Player Detail

Christopher Trotman
GIVEN NAME
Nixon
SURNAME
April 11, 1974, in Durham, NC
BORN
STILL LIVING
DIED
1996—2008
Playing Career
Played from 22-34
PLAYING AGE
Boston Red Sox
Cleveland Indians
New York Mets
Teams Played For
Right Field
PRIMARY POSITION
Boston Red Sox
PRIMARY TEAM
NONE
World Series titles
NONE
NICKNAME
NA
UNIFORM NUMBER
#5 IN LINEUP
BATTING ORDER
6-1 / 195
HEIGHT / WEIGHT
Left / Left
BATTED / THREW
September 21, 1996
Major League Debut
June 28, 2008
FINAL GAME

60

HITTING

50

POWER

40

RUNNING

50

FIELDING

40

THROWING
20 = NOT MLB CALIBER
30 = WELL BELOW AVG
40 = Below Average
50 = MLB AVERAGE
60 = ABOVE AVG
70 = EXCELLENT
80 = RARE, ELITE

Career Stats

GAMES HITS HR RBI AVG
1092
995
137
555
.274

Teammate Team

CATCHER:
First Base:
Second Base:
Shortstop:
Third Base:
Left Field:
Center Field:
Right Field:
Pitcher:
pitcher:
manager:
COMING SOON

BEST SEASON

2003 Red Sox

29 Years Old

.306
AVG
28
HR
87
RBI
81
RUNS
.397
OBP
135
HITS
24
2B
6
3B
.578
SLG
65
BB
4
SB
5.1
WAR

SLASH LINE

AVG OBP SLG
.274
.364
.464

FOR THE TRADITIONALISTS.

VERSUS HIS PEERS

OPS LG OPS COMP
.828
.792
105.0

PLAYER OPS COMPARED TO AVERAGE PLAYER AT HIS POSITION IN HIS LEAGUE AND ERA. OPS = ON-BASE + SLUGGING.

Hall of Fame Worthy?

JAWS JAWS BY HOFER
21.4
58.5

PLAYER JAWS COMPARED TO HOF PLAYER AT HIS POSITION. JAWS = AVERAGE OF CAREER WAR & WAR7.

Trot Nixon Per Season

PER 600 PLATE APPEARANCES COMPARED TO Contemporaries AT HIS POSITION

AB H R 2B 3B HR RBI BB SO SB TB TRB AVG OBP SLG OPS
Nixon
515
141
82
32
4
19
79
72
98
4
239
217
.274
.364
.464
828
AVG RF
533
146
79
30
3
19
54
101
10
239
206
.274
.344
.447
.792

Trot Nixon Rankings

AT Right Field BY THESE SOURCES

BASEBALL EGG HALL OF STATS BASEBALL SCHOLAR JAWS BILL JAMES
97
NR
99
NR
NR
Updated THRU 2021
Updated THRU 2021
UPDATED THRU 2021
Updated THRU 2021
UPDATED THRU 2020

AT Right Field BY VALUE

CAREER LONG PEAK PRIME SHORT PEAK
NR
97
95
NR
CAREER WAR
WAR7
WAR 5 CONSECUTIVE
WAR3

Trot Nixon PLAYER VALUE

WAR COMPARED TO AVERAGE HALL OF FAMER AT HIS POSITION

CAREER WAR7 WAR5C WAR3 WAR PER SN
21.2
21.6
17.1
12.2
3.14
73.7
43.4
30.3
21.5
5.03
BLUE = Trot Nixon
GRAY = AVERAGE HALL OF FAME RF

WIN SHARES COMPARED TO AVERAGE HALL OF FAMER AT HIS POSITION

CAREER WIN SHARES 7 WIN SHARES 5C WIN SHARES 3 WS PER SN
121.5
109.5
UNK
58.5
18.0
389.8
205.2
143.3
96.9
26.7
BLUE = Trot Nixon
GRAY = AVERAGE HALL OF FAME RF

— Explanation of Advanced Statistics —

Wins Above Replacement is a non-standardized sabermetric statistic developed to sum up a player’s total contributions to his team. A player’s WAR value is claimed to be the number of additional wins his team has achieved above the number of expected team wins if that player were substituted with a replacement-level player:

A player’s best seven seasons according to his Wins Above Replacement (WAR). Also called LONG PEAK.

A player’s best five consecutive seasons according to his Wins Above Replacement (WAR). Also called PLAYER PRIME.

A player’s best three seasons according to his Wins Above Replacement (WAR). Also called SHORT PEAK.

A player’s Wins Above Replacement (WAR) per season (calculated for 162 games).

Advanced statistical method devised by Bill James. A Win Share represents one-third of a team win, by definition, and takes into account defense, offense, baserunning, park effects, and level of competition, era, and many other factors.

A player’s best seven seasons according to his Win Shares. A measure of LONG PEAK.

A player’s best five consecutive seasons according to his Win Shares. A measure of a player’s PRIME.

A player’s best three seasons according to his Win Shares. A measure of a player’s SHORT PEAK.

A player’s Win Shares per season (calculated for 162 games).

0
Would love your thoughts, please comment.x
()
x